/
Dashboard and Statistics
Dashboard and Statistics
- Charlotte David
Owned by Charlotte David
Last updated: Jan 27, 2019
Your personal dashboard provides you with a general overview of your events. In order to gain detailed insights into the statistics of a specific event, please go to the respective event website.
Schritt-für-Schritt-Anleitung
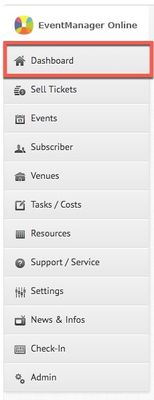
- To access your personal dashboard, please click on the corresponding button in the selection menu:
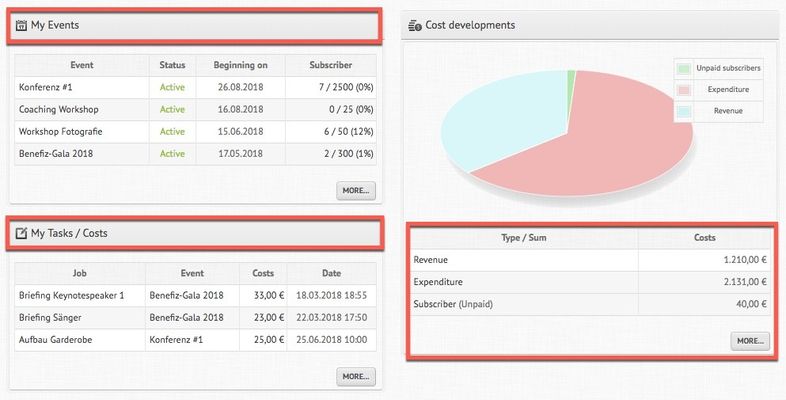
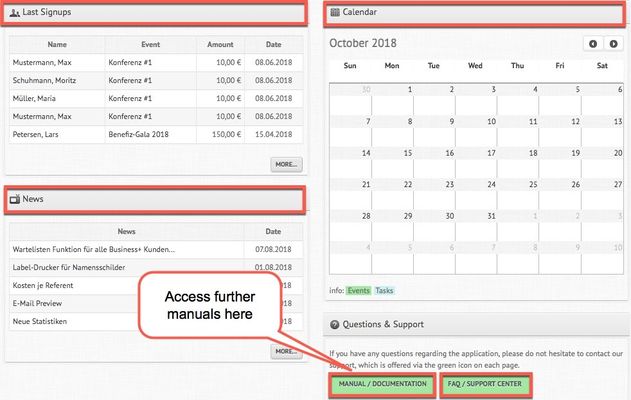
- You will now be able to take a closer look at your events, your tasks and registrations over time. Moreover, the system provides an overview of the cost developments of your events (revenues, expenditures, number of subscribers). Your personal calendar shows upcoming tasks and events as well as latest signups and news. By means of the button "Manual/Documentation" at the bottom of the page you will be able to access further manuals on different topics related to the use of EventManager Online. In case of doubt or specific questions, there is also the possibility to contact our support center by clicking on the corresponding button.
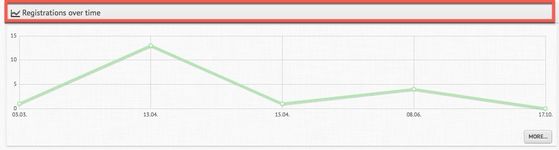
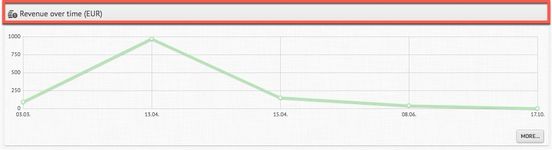
- Furthermore, there are statistics available that visualize registrations as well as revenues over time:
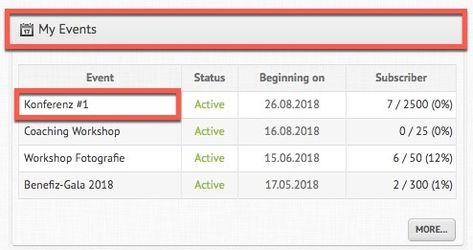
- In order to access the statistics of a specific event of yours, please go to "My Events" and select the one you are interested in. In this case, the event "Konferenz#1" is chosen. By simply clicking on the name of the event, you will reach the corresponding event website. Here, another dashboard will be available containing detailed statistics with regard to that event.
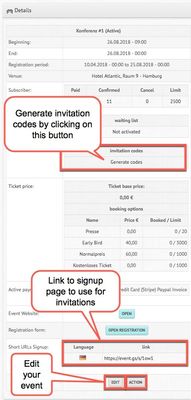
- On the upper left corner, basic data concerning your event will be displayed, such as the event date, the venue or the generated invitation codes. There is also the possibility to copy the registration link in order to use it for your invitations. The button "Action" allows you to edit your event. If you need further guidance through the steps of creating and editing your event, do not hesitate to read through the corresponding manual "Create/Edit Events".
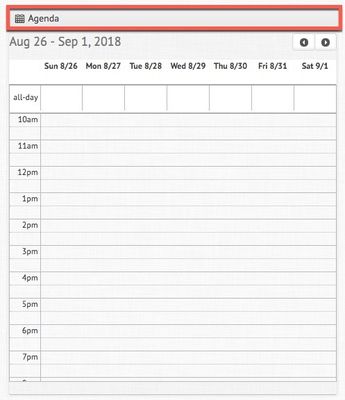
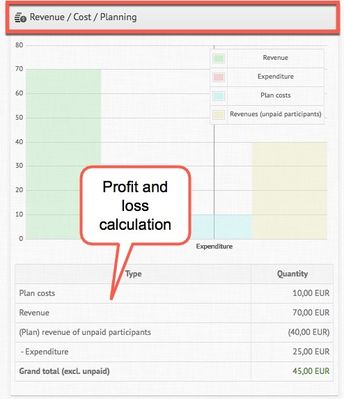
- Moreover, a calendar displays the agenda of the event (if available) and a graphical overview provides you with information on revenues, costs and planning as well as with a profit and loss calculation:
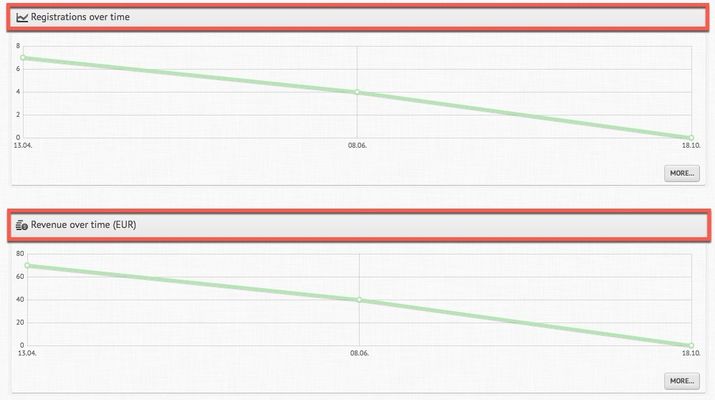
- Similarly to the general dashboard, the event dashboard displays graphs showing registrations and revenue over time:
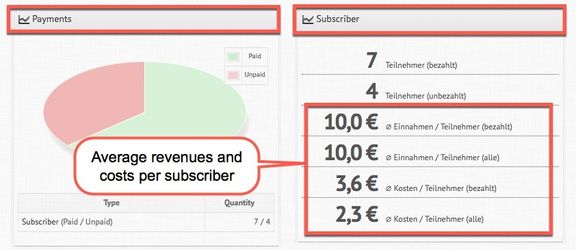
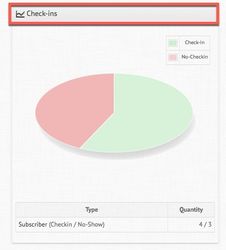
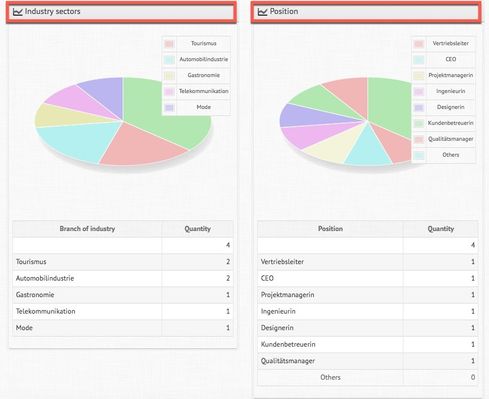
- The section below provides you with further event statistics. The data that serves those statistics needs to be collected by you through the respective questions of the registration questionnaire. How to make those required settings is explained in the manual "Create/Edit Events". Moreover, the event website provides a calculation of average revenues and costs per subscriber:
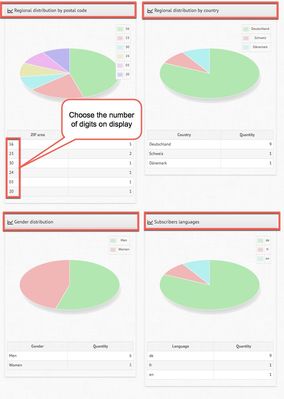
- By the way, the number of digits of the postal code that are displayed in the graph can easily be modified in the user settings.
- Your own query fields, which you can create in the editing section of your event, will be displayed in those graphs as well. However, this only applies for query fields that are checkboxes or selection options (no text fields).
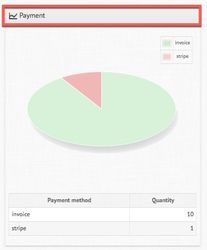
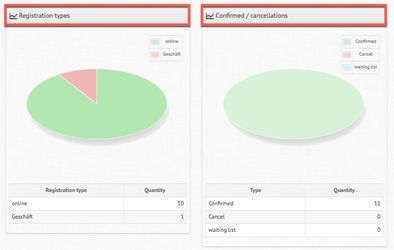
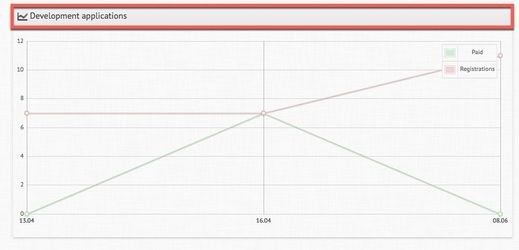
- Right at the bottom of the page you will then find the development of applications/registrations with regard to your event:
Verwandte Artikel
, multiple selections available,
Related content
Subscriber Statistics
Subscriber Statistics
More like this
"Permissions"
"Permissions"
More like this
Manage Agenda
Manage Agenda
More like this
"Pictures"
"Pictures"
More like this
"Registration Form & Layout"
"Registration Form & Layout"
More like this
"Tickets"
"Tickets"
More like this